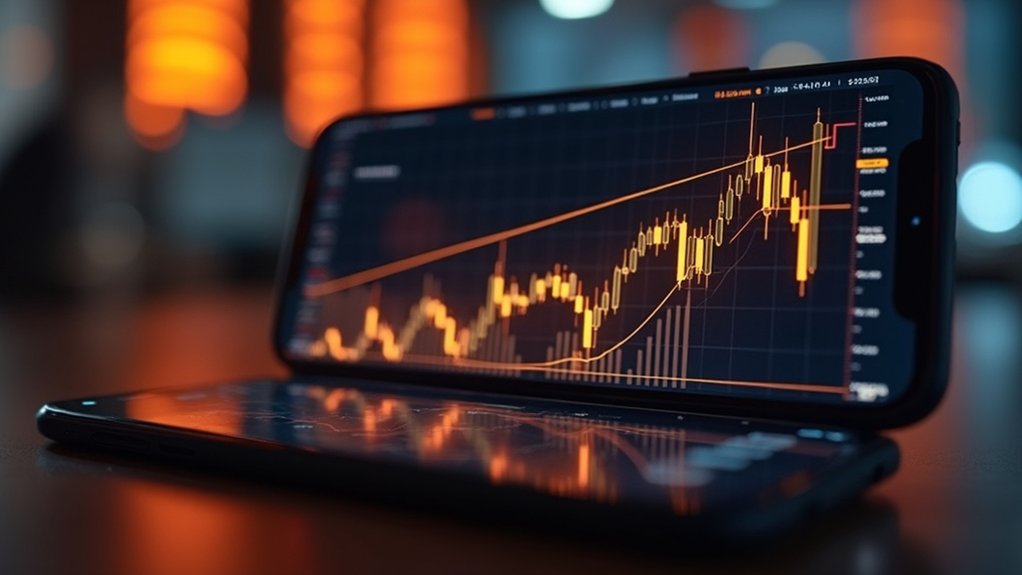
Lightning rarely strikes the same place twice, yet XRP appears poised to defy meteorological wisdom with a technical pattern so rare it has manifested only twice in the cryptocurrency’s tumultuous history—each occurrence preceding rallies of 1,500% and 8,000%, respectively. Analyst EGRAG CRYPTO identified this formation through a three-month green candle sequence, a development that would make even the most jaded chartist pause mid-coffee.
The current technical constellation suggests something approaching inevitability. XRP’s Bollinger Bands have compressed to their tightest configuration since November 2024, while a confirmed W-pattern breakout above the $3.40 neckline provides the kind of textbook bullish signal that trading manuals dream about. At approximately $2.40, XRP sits atop an 8% weekly gain, accompanied by an Relative Strength Index firmly planted in overbought territory—territory that, paradoxically, often signals the beginning rather than end of parabolic moves.
Historical precedent offers both encouragement and caution. The 2017 bull run delivered a staggering 1,903.39% surge following similar technical resolution, a performance that transformed patient investors into inadvertent millionaires. Current projections range from conservative targets of $7-$11 by year’s end to more ambitious scenarios envisioning $22 should historical fractals repeat with mathematical precision. The MVRV golden cross has emerged as another bullish catalyst, with analysts noting this indicator’s previous correlation to a remarkable 630% rally.
Market dynamics appear increasingly favorable. XRP dominance has broken from a bullish pennant formation, while Visible Range Volume Profile analysis reveals a conspicuous “void” above 5.75% dominance—crossing this threshold could trigger what analysts colorfully term a “Kaboom phase.” Unlike traditional banking systems that require multiple days for cross-border settlements, XRP’s ability to process 3-5 second transactions positions it as institutional infrastructure for the next generation of global finance.
The cryptocurrency has already outperformed Bitcoin by 277% over the past year, reaching an all-time high of $3.66 before settling near current levels.
Technical indicators align with remarkable unanimity: the Average Directional Index displays high trend strength, On-Balance Volume confirms growing buyer participation, and whale accumulation patterns suggest institutional interest.
Whether XRP can replicate its historical pyrotechnics remains the market’s most compelling question—though if precedent proves prophetic, even the most conservative projections would render current prices a mere footnote in cryptocurrency’s ongoing narrative of spectacular excess.
